Home Temperature and Humidity Tracking
GEEK POST ALERT
I live in Melbourne (Australia) and if you do know we are known to be the city of all weathers …. in one day. Yeah it can be quite good and bad at times (bad most of the times) because you are either freezing or burning.
Two words : C.L.I.M.A.T.E C.H.A.N.G.E
Anyway that is a topic in itself for another day.
So its the end of September, Spring is here and in theory we should expect good sunny days however the South-East of Australia is being hammered by a “COLD FRONT” and Victoria was experiencing “Spring-time snow”. WOW!
We have gas heating at home but at times like these (especially after the Covid-19 home-arrest started), the bills have been rising.
With my mom-in-law here (who BTW shivers at 20 degrees celsius), I think it was time to come up with a smarter solution at keeping the house warm and the bills low. However to make any changes I had to understand which parts of the house were cooling faster than ever (a.k.a Cool Zones), identify the reasons for cooling and take appropriate actions.
*Rolling sleeves up* – Introducing ……
Operation Frigid Zone
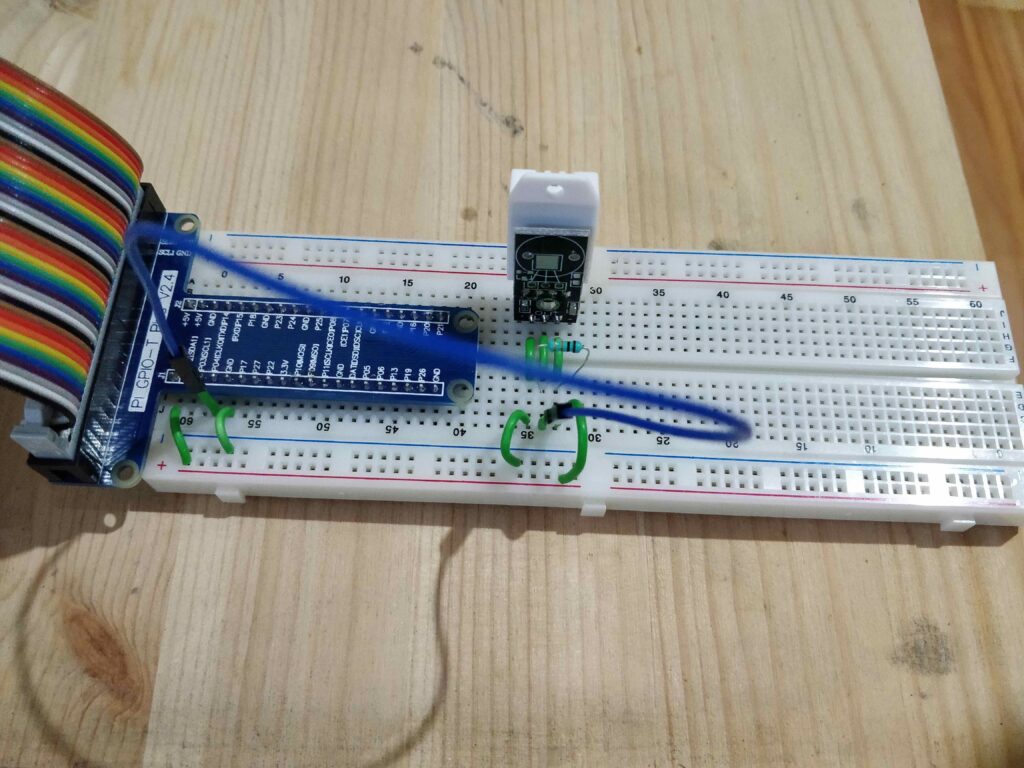
To measure the temperature I chose to build (because I was highly bored and had just finished watching Netflix all day – don’t judge) my very own temperature sensing/tracking unit. I used a Raspberry Pi3 (RPi) and a DHT22 sensor to build the tracking unit.
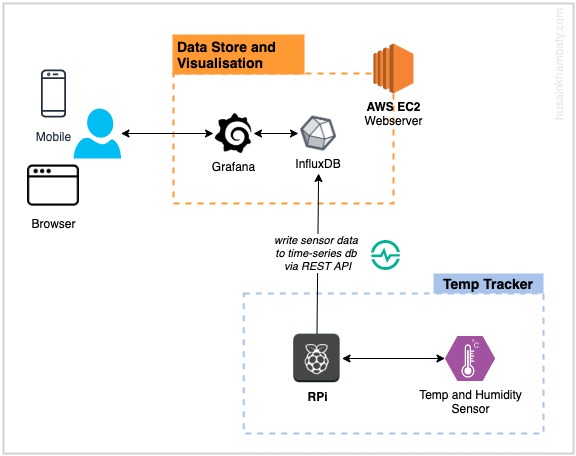
I’ve referred to the tutorial to connect the DHT22 sensor to the RPi and used the Adafruit_DHT python lib. Pretty straight forward.
The only problem was this was writing to the console. I needed it stored to into a Time-series DB so that I could look at the data and analyse it later.
Introducing InfluxDB and Grafana. As a Performance engineer we are quite familier with the two toolsets used to capture performance metrics and visually plot them using dashboards. I thought why not use these for this experiment.
I setup a quick AWS EC2 linux box and installed InfluxDB and Grafana and enabled security and got it all wired up. Now I needed to write the data popping out of the Temp Tracking Unit into InfluxDB (a bit of IoT here).
I used the requests python library to sent an InfluxDB API call with the metric data. As DHT22 sensor is used to capture temperature and humidity, I plotted both the data points and setup a background job that would run infinitely or until it crashed or restarted.
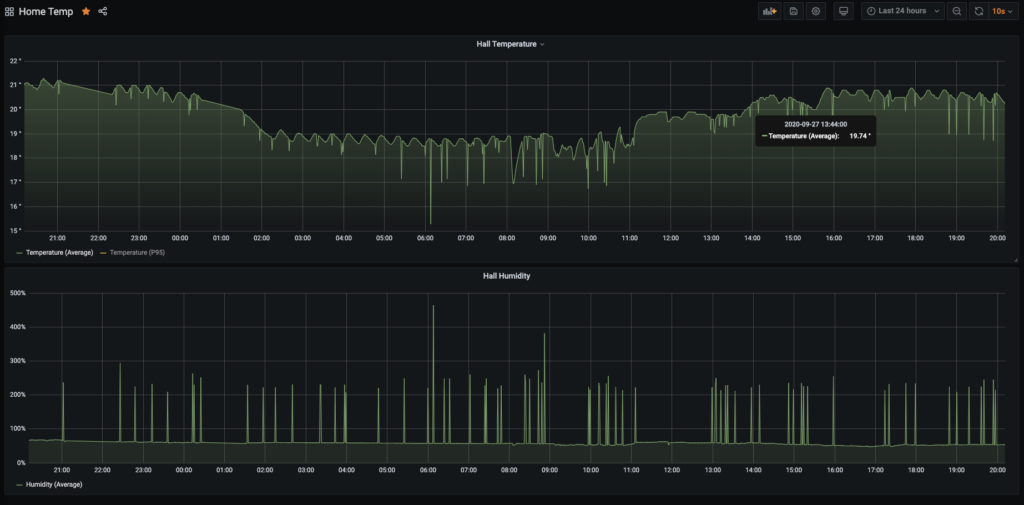
Now using this data I have had multiple units placed in the house especially the cold zones and outside the house to monitor the external temperature. This gives me an understanding of how the temperature outside impacts the temperature inside and what other factors such as blinds being up or down, kitchen area (where heat is produced due to cooking) or keeping bathroom doors closed impacted the overall heating of the house.
Total time spent making this: 3.5 hours. Most of it was getting InfluxDB and Grafana setup the way I wanted it.
I’ve ordered a few ESP32‘s to help build a network of data collectors as ESP32’s are cheaper and more feasible than a Raspi + a collection of sensors and a lot of wires. I have other sensors and use IFTTT that help trigger events and actions based on sensor data but more on that in another blog.
I like the inspiration. What sensor are you using to monitor temperature outdoors? Waterproof?
I’m using a DS18B20 (https://www.amazon.com/DS18B20/s?k=DS18B20) sensor for the outdoors.