In the World of CHAOS

As businesses continue to go digital and with evolution of devices and high-speed internet, the end-user expectations are continuing to increase. With several critical digital infrastructure now moving on to the internet, ensuring these systems remain highly available and resilient to failure is a given for every new system and application design.
If you belong to the world of Performance Engineering or are part of any digital technology delivery, you will have heard of the new terminology called “Chaos Engineering” being thrown around. Let’s get ourselves introduced to this new term and what to expect.
Chaos Engineering is the discipline of experimenting on a system in order to build confidence in the system’s capability to withstand turbulent conditions in production.
https://principlesofchaos.org/
Before the microservices and distributed architecture era began, we lived in a world of DR (disaster recovery) sites with Active-Active or Hot/Warm regions and high availability was achieved with clustering (vertical and horizontal) with applications running in VM’s that run on physical infrastructure hosted in a data-centre and if that hardware failed or application failed then the impact would be massive with a large outage.
Now as most systems are being distributed and loosely coupled using microservices patterns, forming a mesh of API’s both internal and external, it is key for engineers to understand how our application/service behaves when faced with chaotic conditions. As we use the approach of contract testing where we not only evaluate the performance of one service and ensure it meets given NFRs (Non-Functional Requirements), it is important to evaluate how the service would behave when unforeseen technical conditions are observed.
Chaos Engineering is less of ‘Testing’ and more of an ‘Experiment’ because the outcome is not known. As part of testing we expect for it to pass or fail however as part of an experiment we are attempting to explore the behaviour of the service to better prepare for it.
Birth of Chaos Engineering
The earliest time known when the initial experiments were run laying the foundation of Chaos Engineering was back in 2010 when a tool called Chaos Monkey (now part of Gremlin) was created and used by Netflix for running injecting failures and running chaos experiments as part of their migration from physical infrastructure to the cloud. In summary, due to a huge disaster back in 2008, that brought Netflix down for 3 days, Netflix decided to move from monolithic architecture to distributed architecture in the cloud i.e Amazon Web Services. This is where Chaos Monkey was born but also helped birth the principles of Chaos Engineering (read the origin story of Chaos Monkey here). From thereon, Gremlin was born leading the way in tooling for Chaos Experiments (more about tooling below).
Homework before Chaos
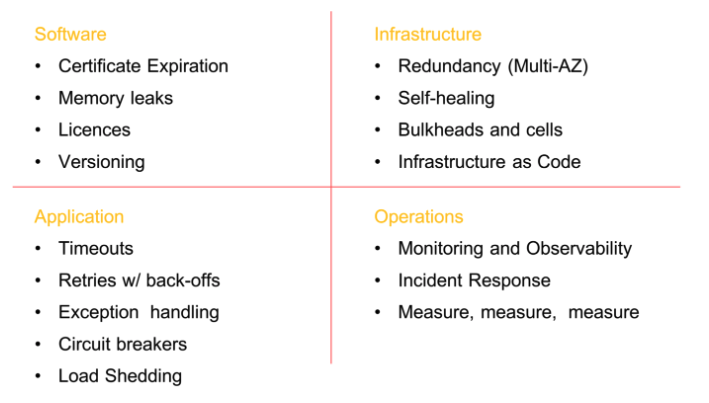
In one of Adrian Hornsby’s articles, he has captured the pre-requisites to running chaos in any system. The below diagram is a good summary of all the homework that needs to be done in order to run and recover from failures. It’s not only about writing good application code but starts at infrastructure level, moving into network and data layers in any enterprise architecture, but also influencing application design and behaviour of people and teams.
Approach to Chaos Engineering
As mentioned above, Chaos Engineering is about conducting experiments with the intention to induce failures with an unknown outcome. The end goal is to observe and capture service behaviour over time.
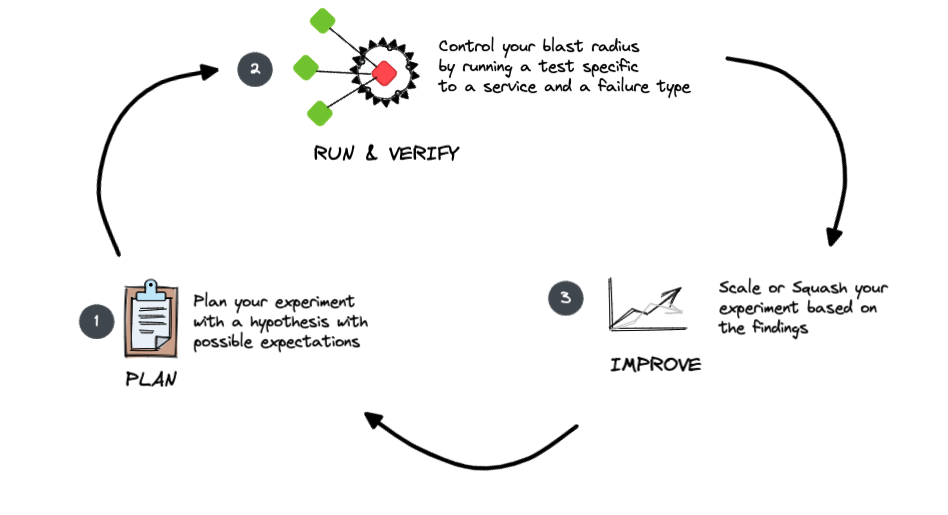
- Planning your experiment
As part of the planning it is key to capture the hypothesis of how you expect your service to behave such as “When a network blackout occurs for x seconds, the service should keep retrying to connect every 500ms”. This will help in ensuring to verify if the service did connect after the network recovered in and around 0.5s.
For your experiment, the fundament question to ask would be ” before you start penning down your first experiments. For most enterprise architecture patterns, it is important to develop standard experiments that could be used within the organisation. - Run and verify your experiment
When simulating your experiment, it is critical to control your blast radius or in simple terms, select the smallest component and inject one type of failure. Selecting multiple components or simulating multiple types of failures will not help in narrowing down on cause and effect. If there are multiple replicas such as app containers then select 1 container out of a cluster to begin with.
Also another important aspect is to have a common key performance metric that can be used to measure the impact of the failure condition such as transactions per second (TPS) to hits per second (HPS). If you see this metric deteriorating below your acceptable thresholds it is key to stop the experiment immediately. As part of this exercise you can also test your alerting capability and your observability across systems and how quick are you able to spot any issues. - Scale or Squash
Once you have run an experiment and have achieved your outcome based on your expectation, you can proceed to scale your experiment to a bigger radius by inducing your failure on other components and observing the impact of the failure. - Create or update a Recovery Plan
Having a recovery plan at hand is critical. Most chaos experiments are run in production and hence it is critical to have a tried and tested recovery plan for every command you run for your chaos experiments. The recovery plan should ensure to have a detailed step-by-step guide to revert or recover any changes that are being done as part of the chaos experiment. While simulating this is it key to also observe if any connectivity is being lost due to an experiment such as network blackhole.
You can read about the principles of chaos engineering here. If you’re into books I would highly recommend reading this.
Types of Failures
The ability to inject different types of failures will mostly be a tooling choice however firstly understanding the idea of different failures and how and whether they apply for your infrastructure is key. The below categorisation is based on my limited experience in running chaos experiments:
- Infrastructure failures
- Network unreliable
- Network latency : Increase the latency by a few ms to observe if response times are exponentially rising or not. Is throughput being impacted.
- Network blackholes : Inject a blackhole to observe how systems behave when loosing connectivity temporarily to other components. Are there retry mechanisms? Are default timeouts being used? Is that impacting overall SLA?
- Resource exhaustion
- CPU : If and when resource limits are reached, it is key to observe and understand how your system behaves. Does your autoscaling kick in? Is your traffic diverted to the new instance(s)? How much throughput is impacted?
- Memory : Understand if memory exhaustion causes application to crash. Does it auto-recover? Does disk I/O increase? Do we observe number page faults?
- Disk : Does this impact throughput? Higher disk I/O causes high CPU wait time, does this cause response times to go up? What is our recovery plan on this?
- DNS unavailability
- Network unreliable
- Application or process level failures
- Higher rate of different type of errors/exceptions : A higher rate of errors/exceptions can cause throughput to drop and response times to increase. Understanding the impact and how to isolate threads impacting each other is key.
- Component unavailability : If any downstream or dependent component is unavailable, it is important to understand how your system will behave. What retry capabilities or redundancies are available? Are we connecting to isolated resource IPs or hosts or connecting to cluster hosts thereby delegating repoint of available hosts.
Key metrics to capture
While running your experiments it is important to capture some key metrics in order to observe them across multiple runs and observe improvements, if any. This also helps lay the ground work for any process improvements required for ops teams and any increased observability.
- MTTD – Mean Time to detect
- Time to alert or notify
- MTTR – Mean time to repair/recover
- MTBF – Mean time between failures
References
- Chaos Engineering — Part 1 – Adrian Hornsby (2019, July) https://medium.com/the-cloud-architect/chaos-engineering-ab0cc9fbd12a
- Chaos Engineering — Part 3 – Adrian Hornsby (2019, Nov) https://medium.com/the-cloud-architect/chaos-engineering-part-3-61579e41edd8
- 4 Chaos Experiments to Start With – Matt Jacobs (2017, Nov) https://www.gremlin.com/community/tutorials/4-chaos-experiments-to-start-with/